

- The relentless rally in in tech stocks abruptly turned into a sell-off last week, as stronger labor data reinforced market projections for a rate hike. Along with disappointing results from Broadcom (AVGO) and equity issuances from some tech giants to fund additional AI capital expenditures, there was broad unwinding in the concentrated AI trade last week.
- This week, we expect the headlines to be SpaceX IPO to be in focus, as it is poised to be the largest IPO of all time. SpaceX (SPCX) concluded its roadshow with strong demand for IPO shares leading to oversubscription, with the final expected pricing to be approximately $1.7 trillion, with share trading debut to take place on Friday. The index committee at S&P announced that it would not alter its index rules to accommodate a “fast track” inclusion for SpaceX, meaning that the company will not enter the S&P for at least one year after going public. Other indices, such as the Nasdaq, are expected to include SpaceX soon after the IPO.
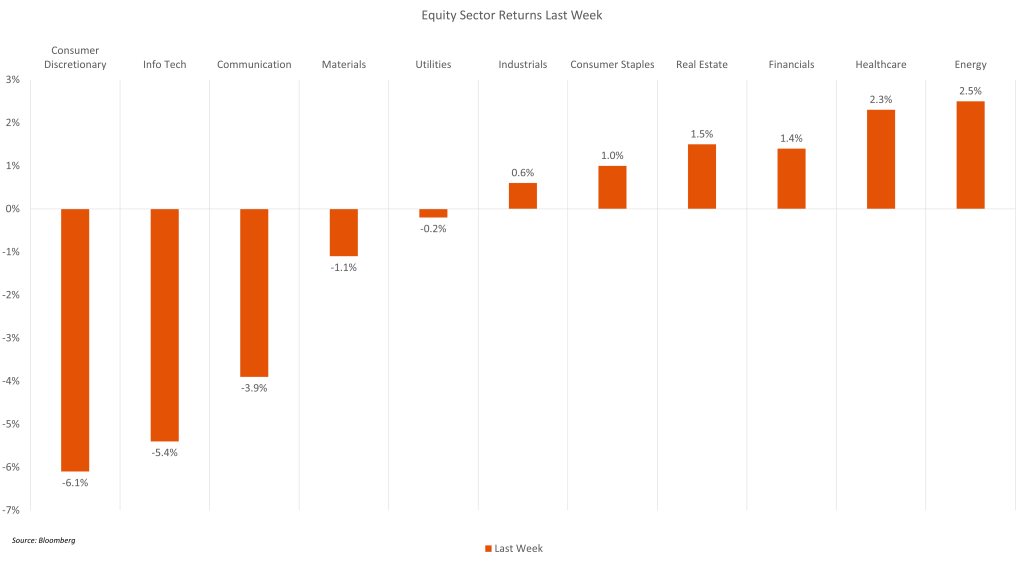
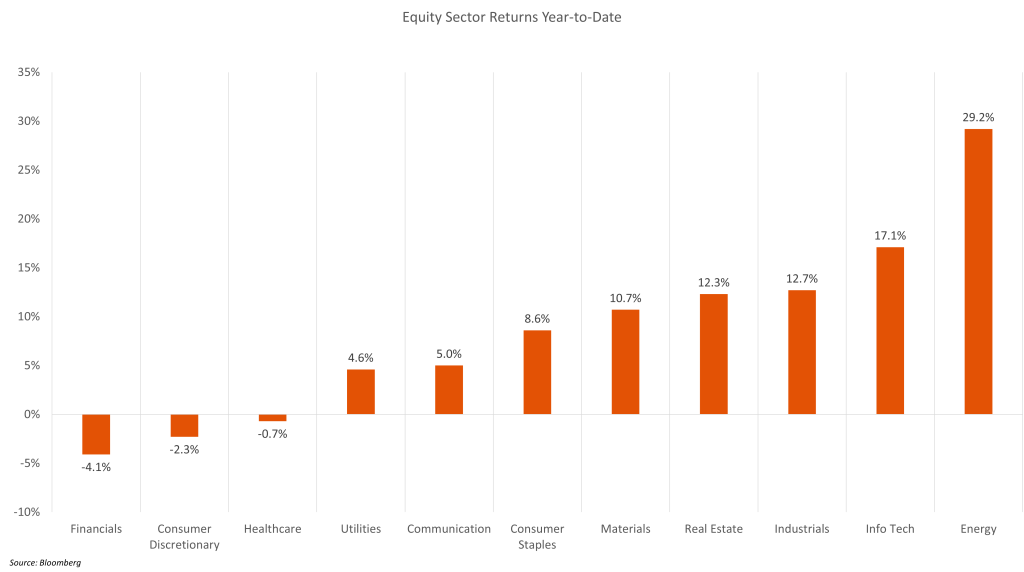
- Although last week’s Friday’s drop was led lower the Consumer Discretionary, Info Tech and Communications sectors, the S&P remains higher nearly 8% year-to-date. Energy is the best performing sector, followed by Info Tech.
- In earnings last week, Broadcom’s in-line results and tepid Q2 forecast halted chip stocks exponential momentum. Palo Alto (PANW) and Crowdstrike (CRWD) posted rather in-line annual guidance, which also disappointed investors that were looking for justifications to the recent strong run-ups. On a more positive note, optimistic earnings results were provided by Hewlett Packard Enterprises (HPE), Victoria’s Secret (VSXY), and Service Titan (TTAN).
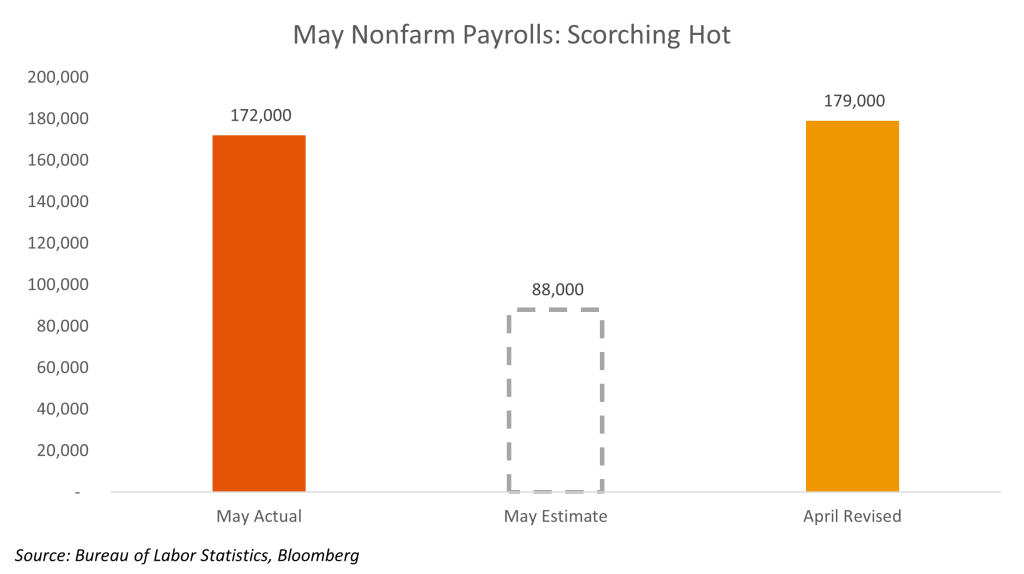
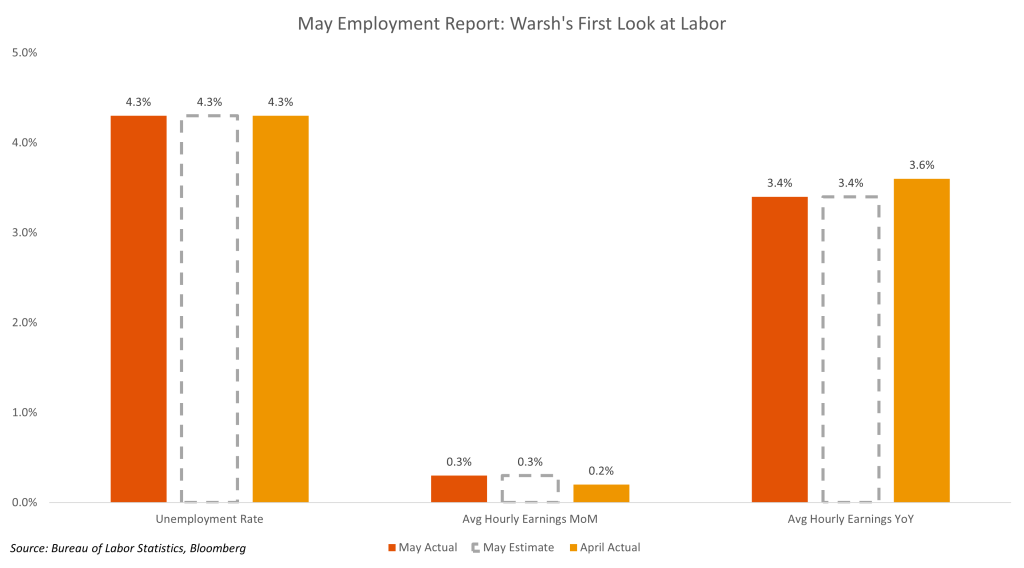
- Last week, the May payroll report showed a healthy labor market giving recently appointed Fed Chair Warsh his first look at labor statistics. Nonfarm payrolls rose by 172,000 above the highest estimate and consensus for 88,000. April was also revised higher to 179,000 from 115,000. The unemployment rate was stable at 4.3%, while average hourly earnings rose by 3.4% YoY, both in-line with estimates.
The Week Ahead
- 1Q26 earnings season continues this week with earnings from Oracle (ORCL), Adobe (ADBE), Campbells Soup (CPB), SailPoint (SAIL) and Chewy (CHWY).
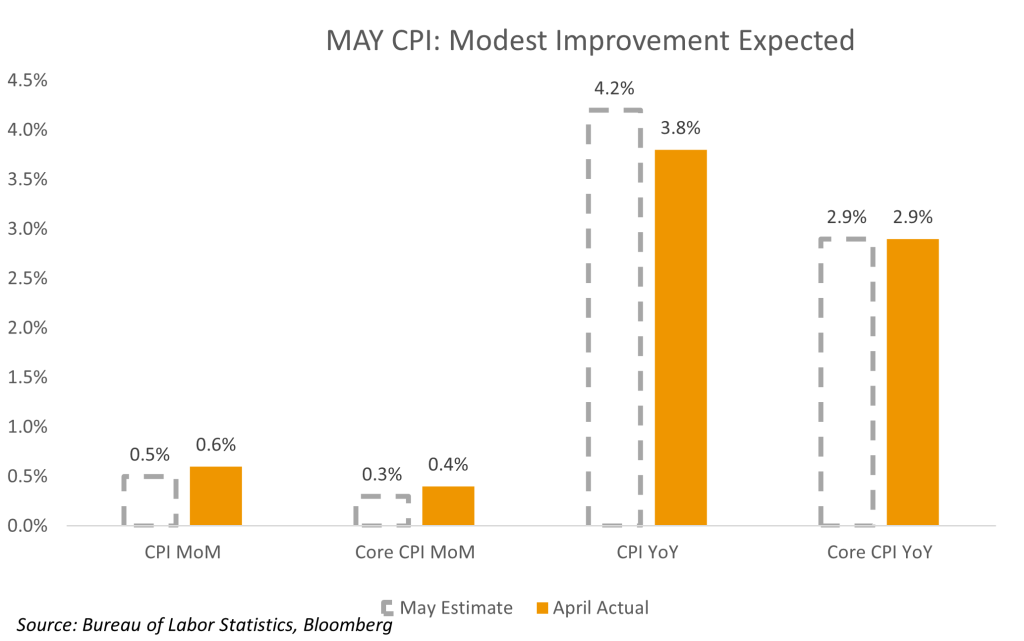
- This week there is the first look at inflation data for May. CPI is expected to climb by 0.5% MoM on a headline basis and 0.3% using core. On a YoY basis, headline CPI is estimated to be 4.2% and 2.9% on a core basis excluding food and energy.
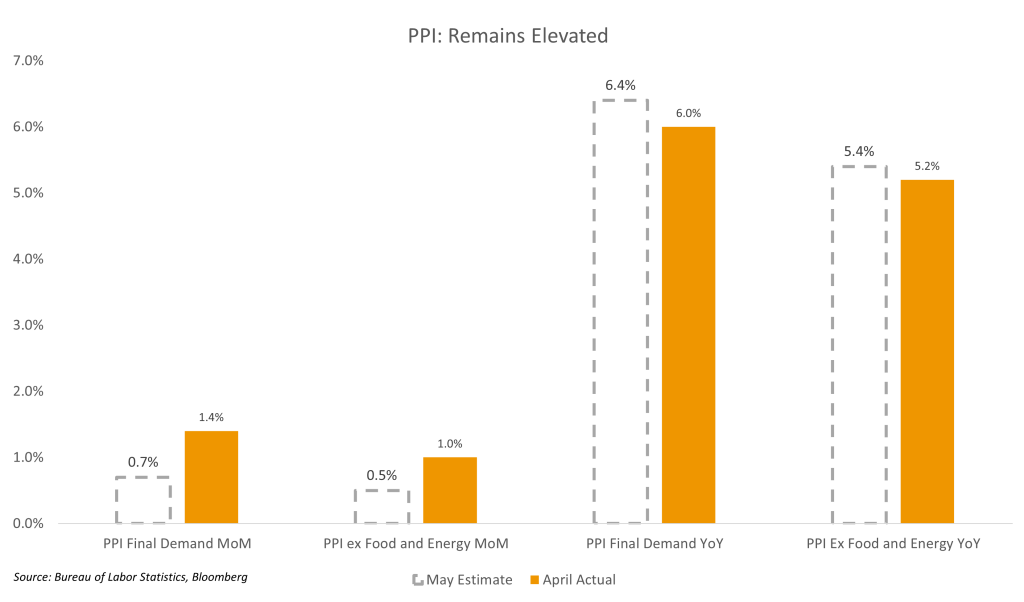
- PPI for May will also be released this week. PPI Final Demand MoM is estimated to cool to 0.7% from 1.4% in April. PPI Final Demand YoY is expected to remain elevated at 6.0% from 6.4% prior. Excluding Food and Energy, consensus for PPI in May is 0.5% MoM and 5.4% YoY.
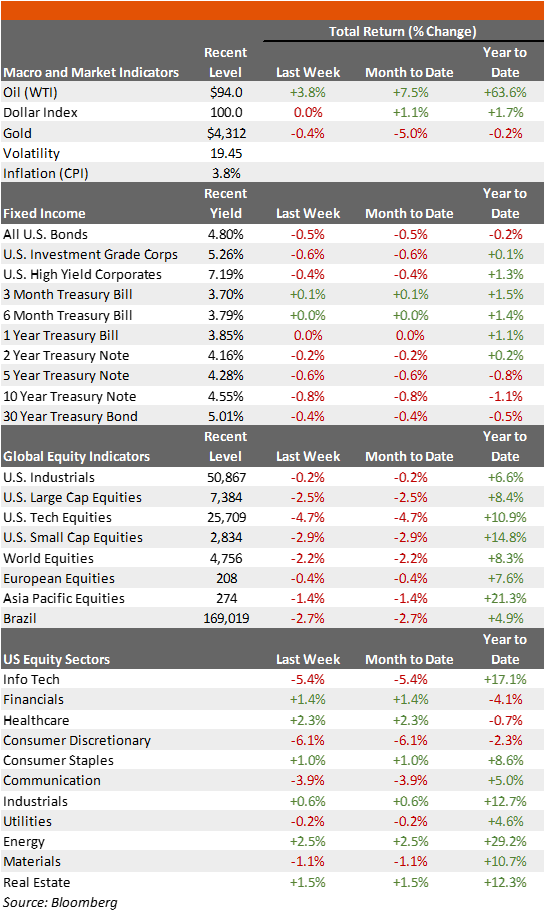
Market Summary – Returns and Yields
For additional insights, be sure to check out last week’s blog post.
Definitions, sources, and disclaimers
This content is being published by Amerant Investments, Inc (Amerant Investments), a dually registered broker-dealer and investment adviser registered with the Securities and Exchange Commission (SEC) and member of FINRA/SIPC. Registration does not imply a certain level of skill, endorsement, or approval. Amerant Investments is an affiliate of Amerant Bank.
Definitions:
- Gross Domestic Product (GDP): A comprehensive measure of U.S. economic activity. GDP is the value of the goods and services produced in the United States. The growth rate of GDP is the most popular indicator of the nation’s overall economic health. Source: Bureau of Economic Analysis (BEA).
- GDPNow is not an official forecast of the Atlanta Fed. Rather, it is best viewed as a running estimate of real GDP growth based on available economic data for the current measured quarter. There are no subjective adjustments made to GDPNow—the estimate is based solely on the mathematical results of the model. In particular, it does not capture the impact of COVID-19 and social mobility beyond their impact on GDP source data and relevant economic reports that have already been released. It does not anticipate their impact on forthcoming economic reports beyond the standard internal dynamics of the model.
- The Current Employment Statistics (CES) program produces detailed industry estimates of nonfarm employment, hours, and earnings of workers on payrolls. CES National Estimates produces data for the nation, and CES State and Metro Area produces estimates for all 50 States, the District of Columbia, Puerto Rico, the Virgin Islands, and about 450 metropolitan areas and divisions. Each month, CES surveys approximately 142,000 businesses and government agencies, representing approximately 689,000 individual worksites. Source: Bureau of Labor Statistics (BLS).
- Initial Claims: An initial claim is a claim filed by an unemployed individual after a separation from an employer. The claimant requests a determination of basic eligibility for the UI program. When an initial claim is filed with a state, certain programmatic activities take place and these result in activity counts including the count of initial claims. The count of U.S. initial claims for unemployment insurance is a leading economic indicator because it is an indication of emerging labor market conditions in the country. However, these are weekly administrative data which are difficult to seasonally adjust, making the series subject to some volatility. Source: US Department of Labor (DOL).
- The Consumer Price Index (CPI): Is a measure of the average change over time in the prices paid by urban consumers for a market basket of consumer goods and services. Indexes are available for the U.S. and various geographic areas. Average price data for select utility, automotive fuel, and food items are also available. Source: Bureau of Labor Statistics (BLS).
- The national unemployment rate: Perhaps the most widely known labor market indicator, this statistic reflects the number of unemployed people as a percentage of the labor force. Source: Bureau of Labor Statistics (BLS).
- The number of people in the labor force. This measure is the sum of the employed and the unemployed. In other words, the labor force level is the number of people who are either working or actively seeking work.Source: Bureau of Labor Statistics (BLS).
- Advance Monthly Sales for Retail and Food Services: Estimated monthly sales for retail and food services, adjusted and unadjusted for seasonal variations. Source: United States Census Bureau.
- Federal Open Market Committee (FOMC): Responsible for implementing Open market Operations (OMOs)–the purchase and sale of securities in the open market by a central bank—which are a key tool used by the US Federal Reserve in the implementation of monetary policy. Source: Federal Reserve.
- The Federal Funds Rate: Is the interest rate at which depository institutions trade federal funds (balances held at Federal Reserve Banks) with each other overnight. When a depository institution has surplus balances in its reserve account, it lends to other banks in need of larger balances. In simpler terms, a bank with excess cash, which is often referred to as liquidity, will lend to another bank that needs to quickly raise liquidity. Source: Federal Reserve Bank of St. Louis.
- The “core” PCE price index: Is defined as personal consumption expenditures (PCE) prices excluding food and energy prices. The core PCE price index measures the prices paid by consumers for goods and services without the volatility caused by movements in food and energy prices to reveal underlying inflation trends. Source: Bureau of Economic Analysis (BEA).
Sources: U.S. Bureau of Economic Analysis (BEA), Bureau of Labor Statistics (BLS), U.S. Department of Labor (DOL), Federal Reserve, Federal Reserve Economic Database (FRED), Federal Reserve Bank of Atlanta, U.S. Census Bureau, Department of Housing and Human Development (HUD), U.S. Department of Agriculture, U.S. Energy Information Administration (EIA), U..S Department of the Treasury, Office of the United States Trade Representative (USTR), U.S. Department of Commerce, data.gov, investor.gov, usa.gov, congress.gov, whitehouse.gov, U.S. Securities and Exchange Commission (SEC), Morningstar, The International Monetary Funds (IMF), The World Bank (WB), European Central bank (ECB), Bank of Japan (BOJ), European Parliament, Eurostats, Organization for Economic Co-operation and Development (OECD), National Bureau of Statistics of the People’s Republic of China, Organization of the Petroleum Exporting Countries (OPEC), World health organization (WHO).
Financial Markets – Recent Prices and Yields, and Weekly, Monthly, and YTD (Table): Bloomberg, Weekly Market Data is in USD and refers to the following indices: Macro & Market Indicators: Volatility (VIX); Oil (WTI); Dollar Index (DXA); Inflation (CPI YoY); Fixed Income: All U.S. Bonds (Bloomberg Aggregate Index); Investment Grade Corporates (Bloomberg US Corporate Index); US High Yield (Bloomberg High Yield Index), Treasuries (ICE BofA Treasury Indices); Equities: U.S. Industrials (Dow Jones Industrial Average); U.S. Large Caps (S&P 500); U.S Tech Equities (Nasdaq Composite); European (MSCI Euope), Asia Pacific (MSCI AP), and Latin America Equities (MSCI LA); Sectors (S&P 500 GICS Sectors) Source: Bloomberg. Fed Funds Rate probabilities, Source: CME FedWatch Tool.
Important Disclosures:
The information provided here is for general informational purposes only and should not be considered a customized recommendation, personalized investment advice offer, or solicitation for the purchase or sale of any security or investment strategy. The investment strategies mentioned here may not be suitable for everyone. Each investor needs to review an investment strategy for his or her own situation before making any investment decision.
This information is obtained by AMTI from third-party providers from what are considered reliable sources. However, its accuracy, completeness or reliability cannot be guaranteed. Examples provided are for illustrative purposes only and not intended to be reflective of results you can expect to achieve. All expressions of opinion are subject to change without notice in reaction to changes in market conditions. By using such information, you release and exonerate AMTI from any responsibility for damages, direct or indirect, that may result from such use. Consult the issuer of any investment for the most up-to-date and accurate information.
All references to performance refer to historical data. There could be benchmarks used that do not reflect the performance of funds or other products with similar objectives
Presentation does not apply in jurisdictions where its use has not been approved. Some products or strategies may be complex or unusual. Make sure you have a clear understanding of the products before investing. Investments may have different tax consequences in different jurisdictions and will depend on the circumstances. AMTI does not offer legal or tax advice, please consult your legal, CPA, or other tax professional regarding your situation.
Before investing you must consider carefully the investment objectives, risks, charges and expenses of the underlying funds of your selected portfolio. Please contact AMTI to request the prospectus, private placement memorandum or other offering materials containing this and other important information. Please read these materials carefully before investing.
Not FDIC Insured | Not Bank Guaranteed | May Lose Value | Not Insured By Governmental Agencies | Member FINRA/SIPC, Registered Investment Advisor
Additional Risks:
- Past performance is no guarantee of future returns.
- There is no assurance the Fund will pay distributions in any particular amount, if at all. Any distributions the Fund makes will be at the discretion of the Fund’s Board of Trustees
- There can be no assurance that any Fund or investment will achieve it objectives or avoid substantial losses. Actual results may vary
- The value of the investments varies and therefore the amount received at the time of sale might be higher or lower than was originally invested. Actual returns might be better or worse than the ones shown in this informative material.
- Limited liquidity: Investors should not expect to be able to sell shares regardless of how the Fund performs. Investors should consider that they may not have access to the money they invest for an extended period of time.
- Volatile markets: Because an investor may be unable to sell its shares, an investor will be unable to reduce its exposure in any market downturn
- Funds may invest in securities that are rated below investment grade by rating agencies or that would be rated below investment grade if they were rated. Below investment grade securities, which are often referred to as “junk,” have predominantly speculative characteristics with respect to the issuer’s capacity to pay interest and repay principal. They may also be illiquid and difficult to value
Please review the prospectus or related materials for further details regarding risks and other important information. For additional disclosures and other information regarding AMTI including our customer relationship summary, please visit: https://www.amerantbank.com/personal/investing/
Related posts

