

- Major indexes sold off significantly after setting new highs earlier last week, as strong earnings results from big tech were overshadowed by surprisingly negative economic data.
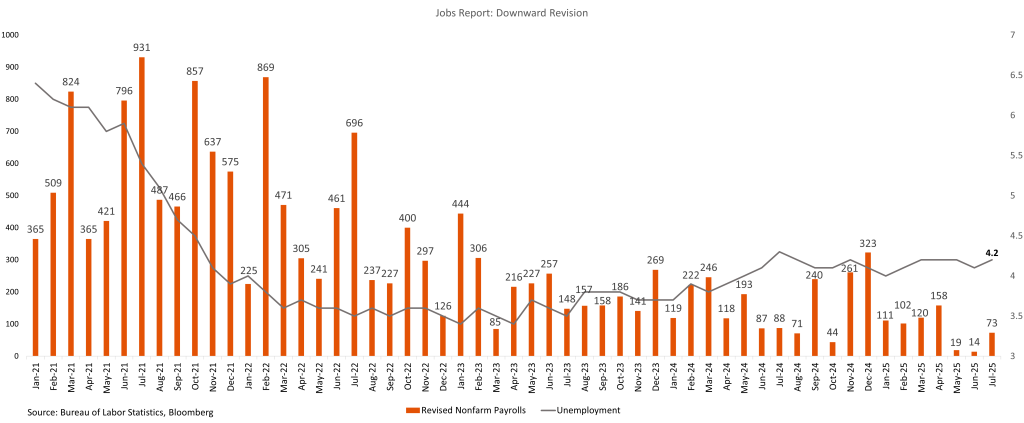
- The major macro news for the week was the July jobs report, which raised concerns over the health of the U.S. economy. July’s non-farm payroll growth slowed more than expected, but the steep downward revisions for May and June were the biggest drivers of negative sentiment, suggesting a significant cooling in the labor market. The Unemployment rate slightly increased to 4.2% in July (compared to 4.1% in June), as the participation rate decreased slightly (62.2%, down 50 bps) and average hourly wages rose 3.9% YoY (prior 3.9%).
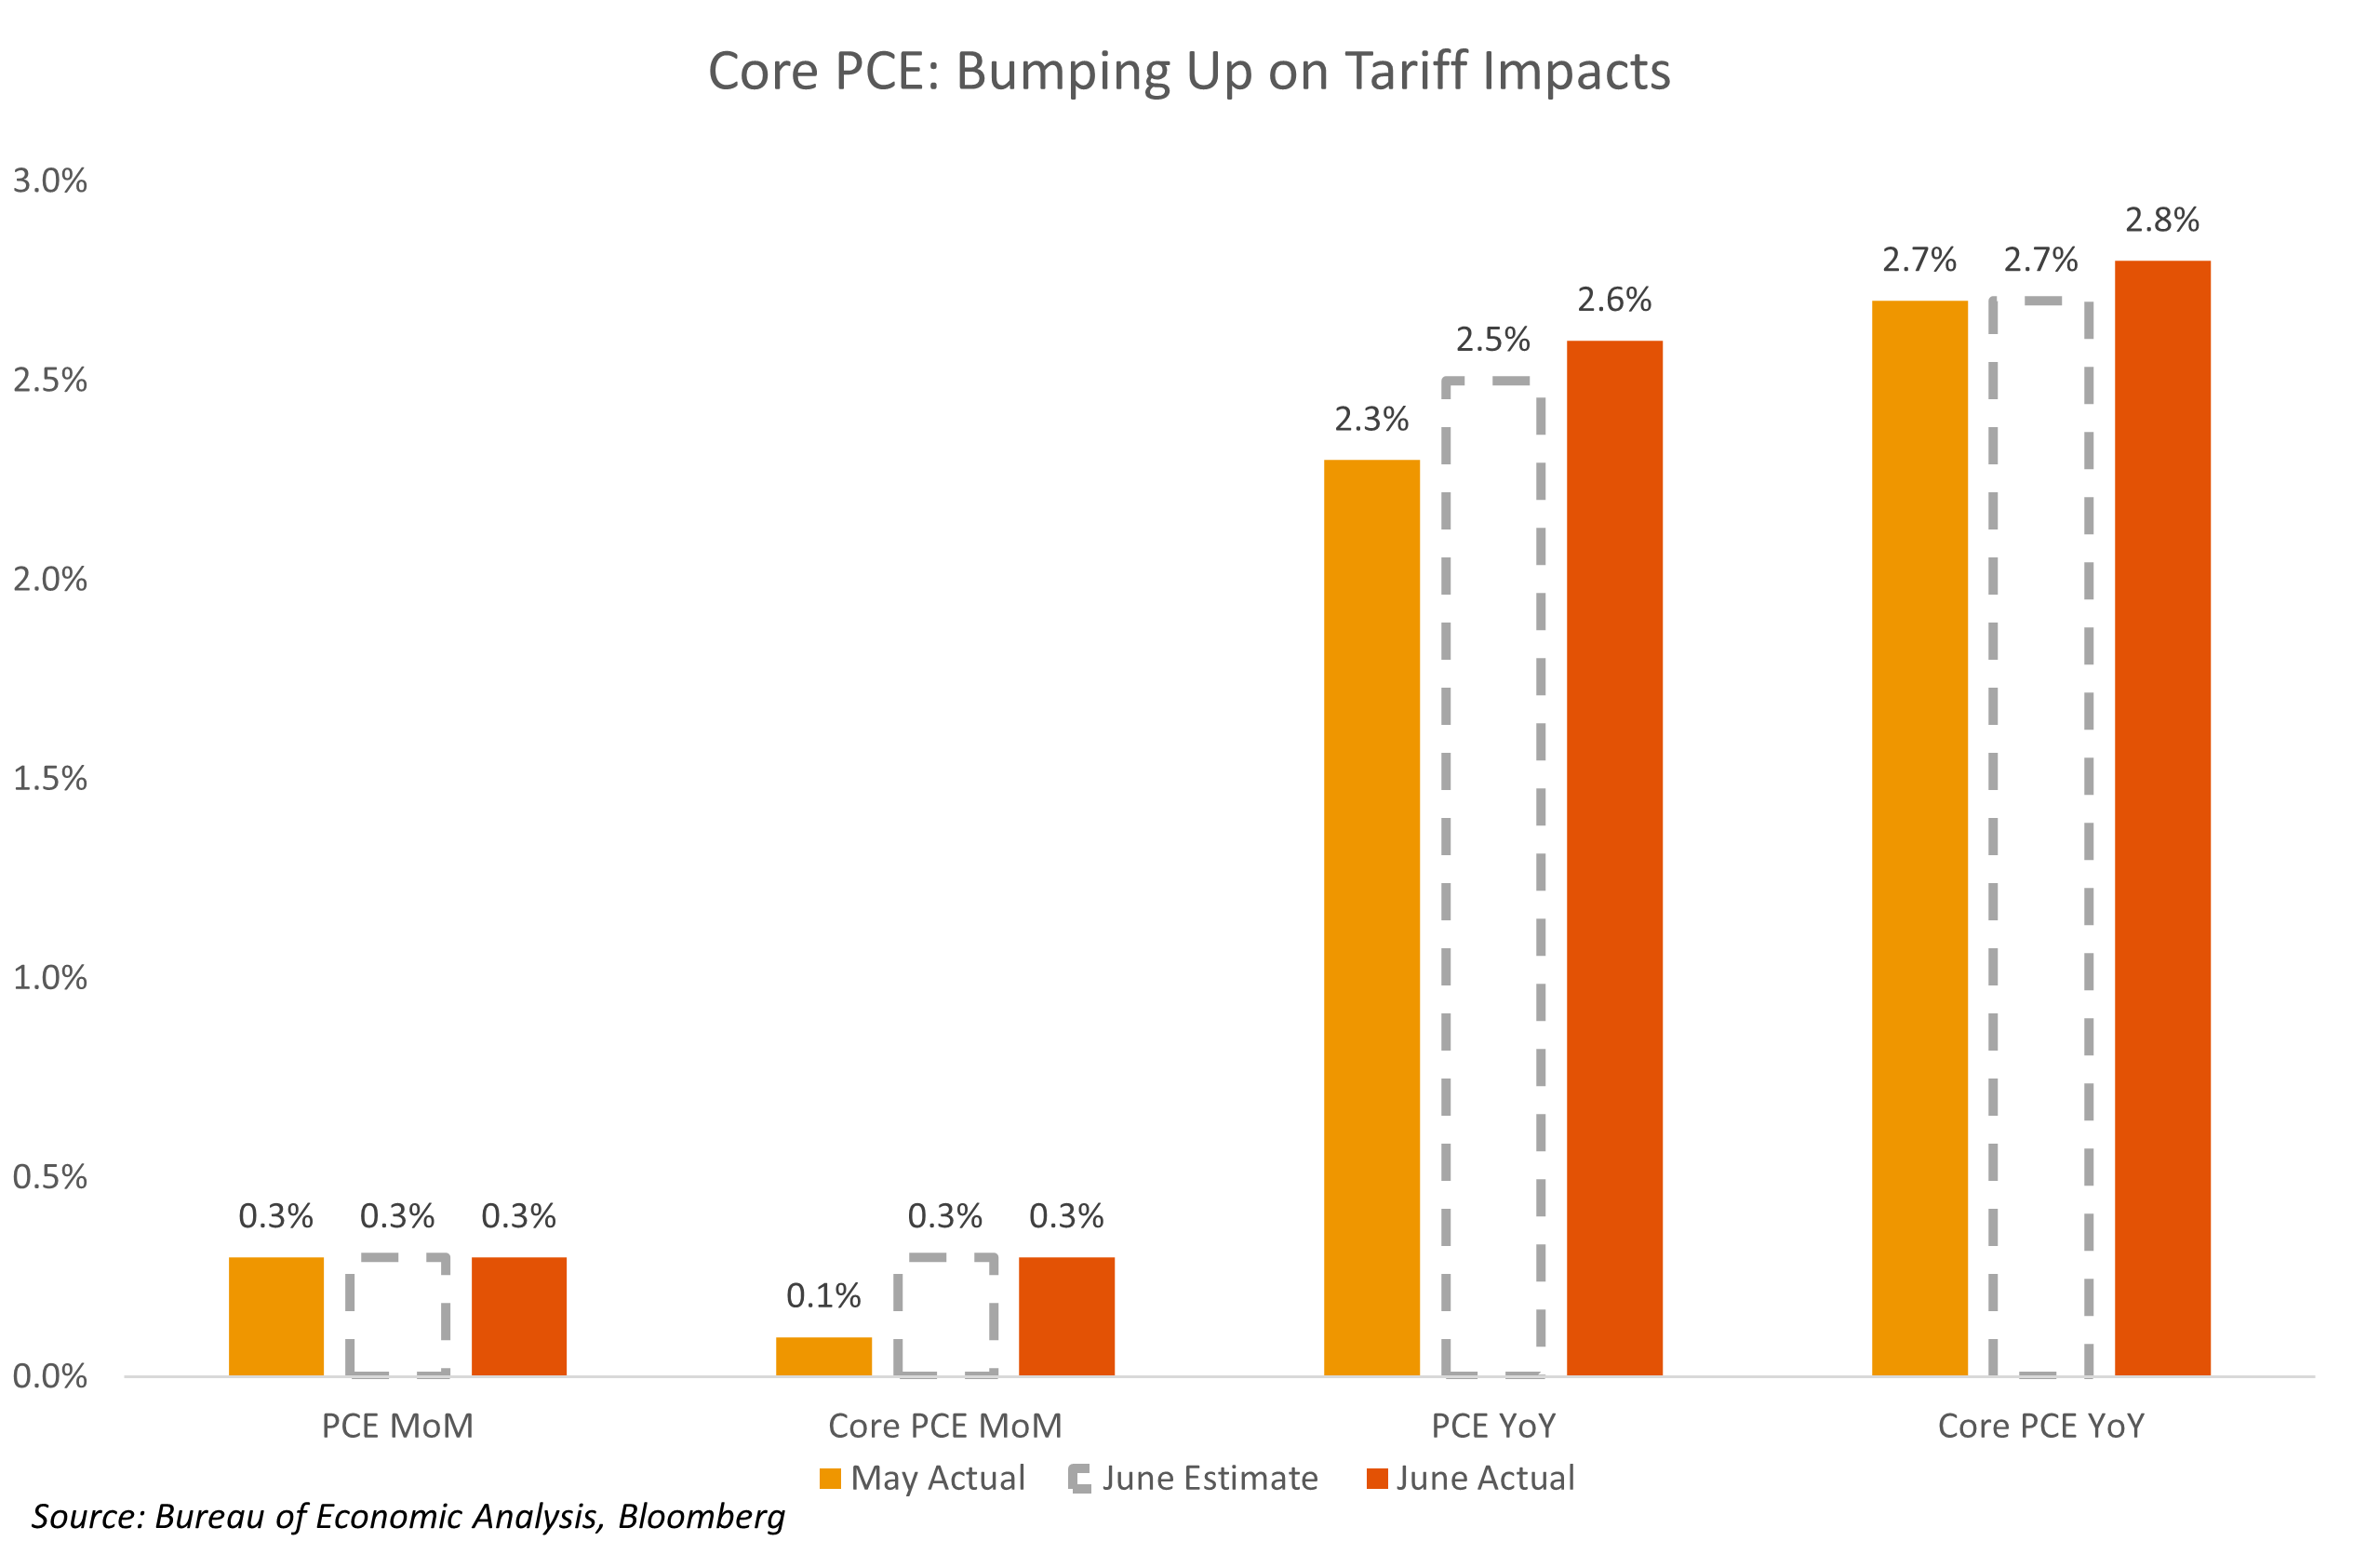
- The core Personal Consumption Expenditures (PCE) price index, the Federal Reserve’s preferred inflation gauge, rose 2.8% YoY in June, exceeding the 2.7% forecast. On a monthly basis, core PCE increased 3.0%, which was in line with expectations. The headline PCE also rose 2.6% YoY, slightly above the 2.5% estimate.
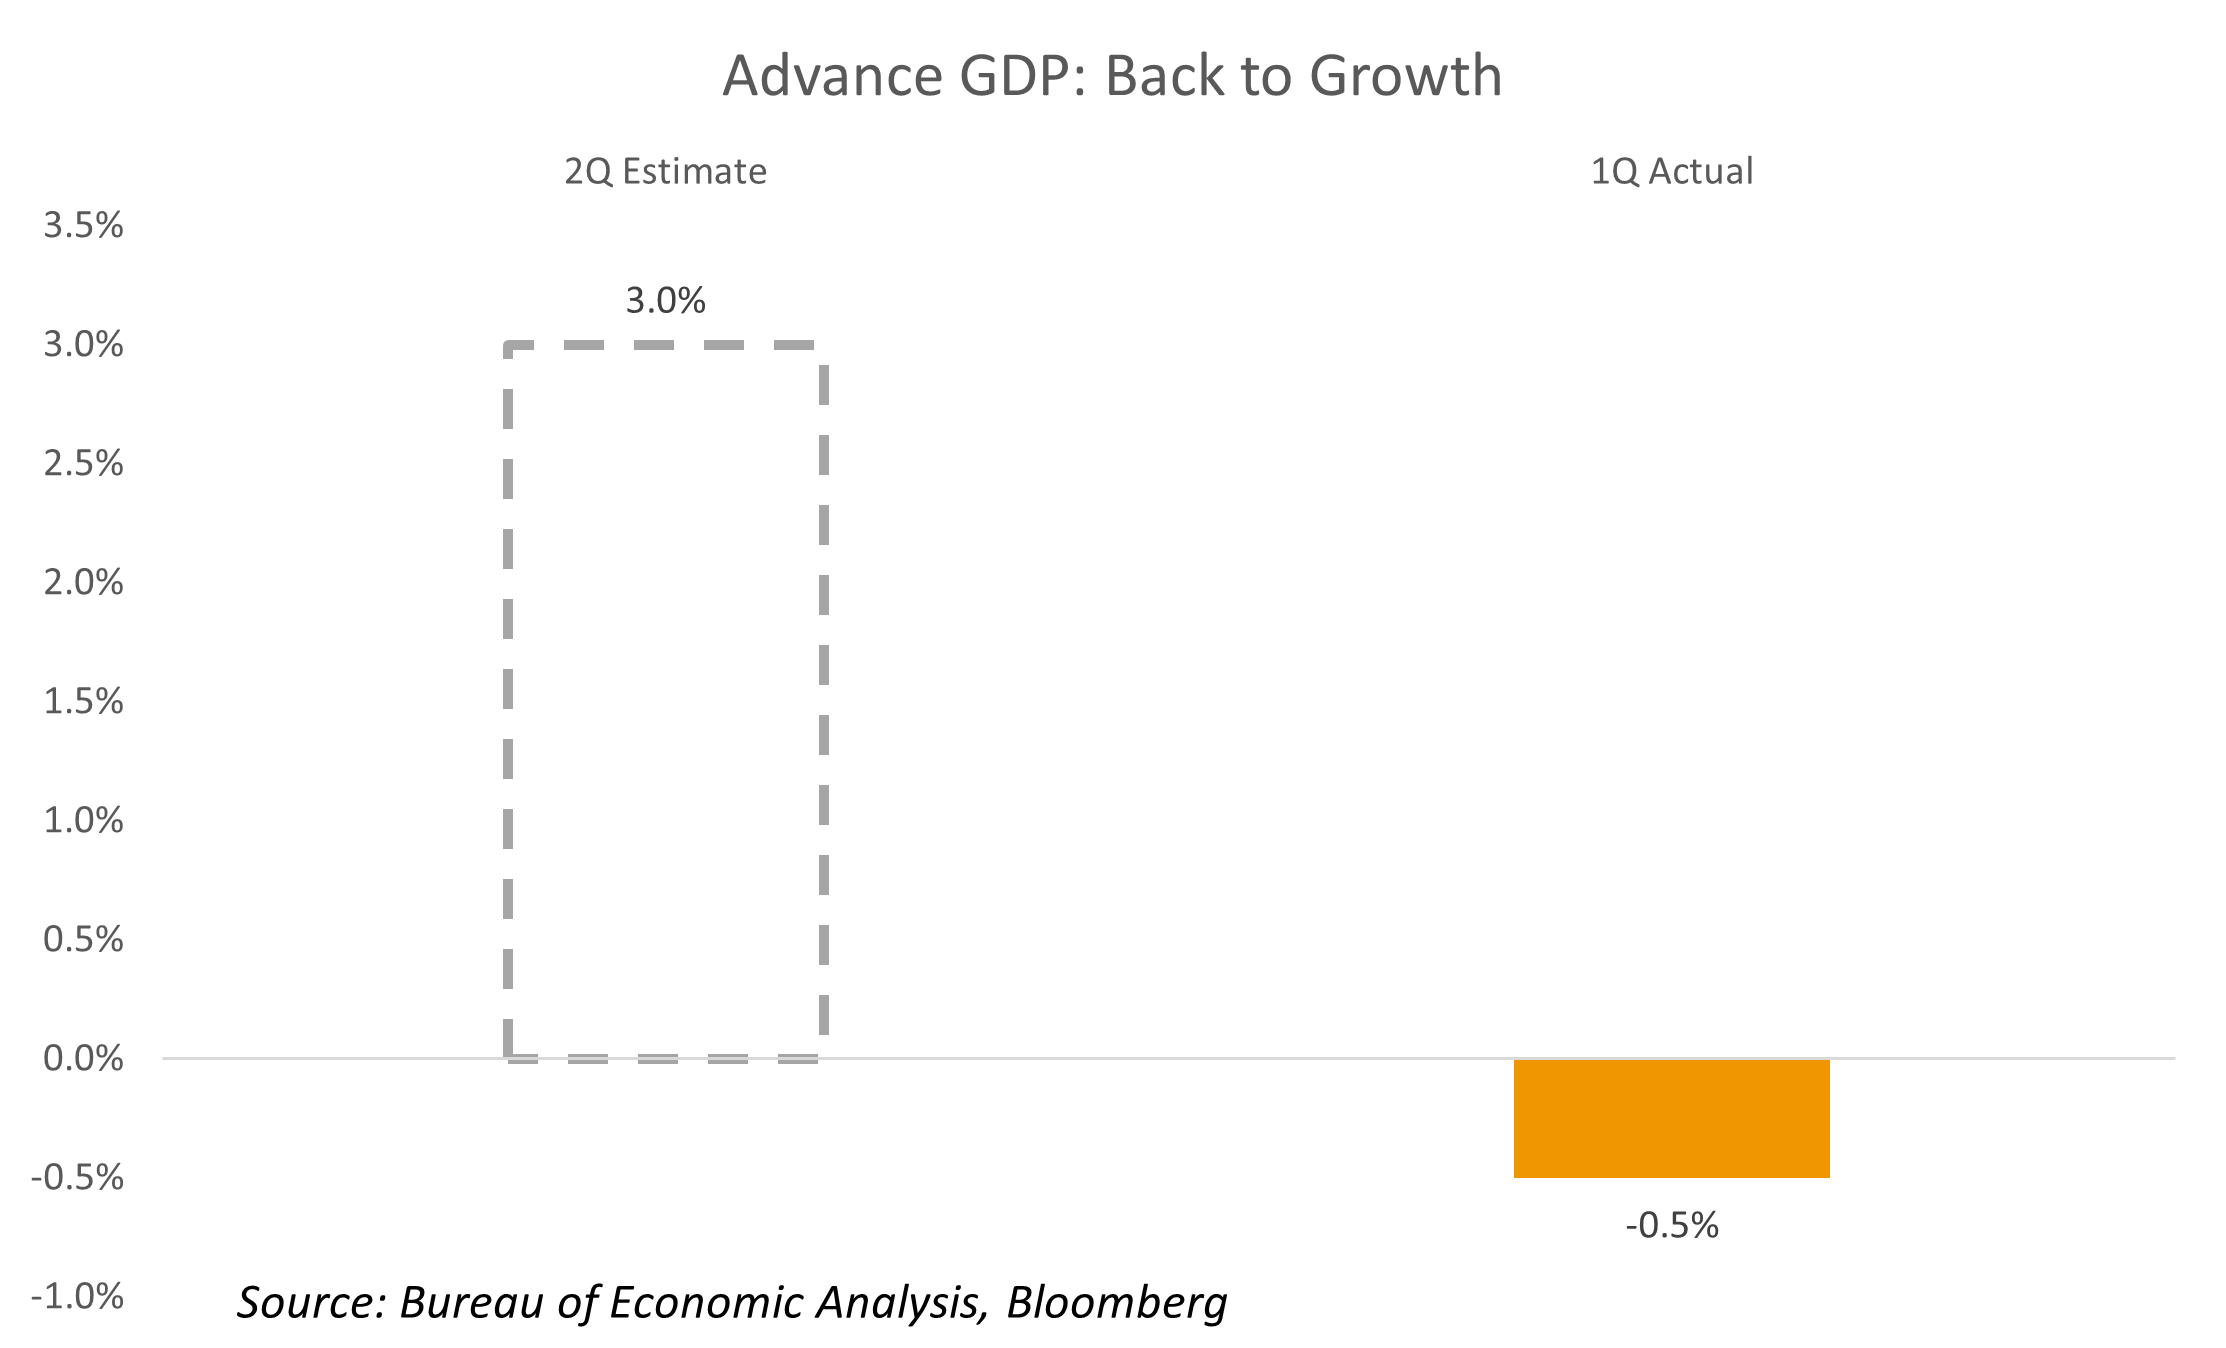
- U.S. GDP advanced estimates reported that the second quarter GDP expanded 3.0%, a slightly higher turnaround from the previous quarter. While seemingly positive, the data was likely skewed by tariffs due to potential front-running and business cutbacks on foreign-made goods.
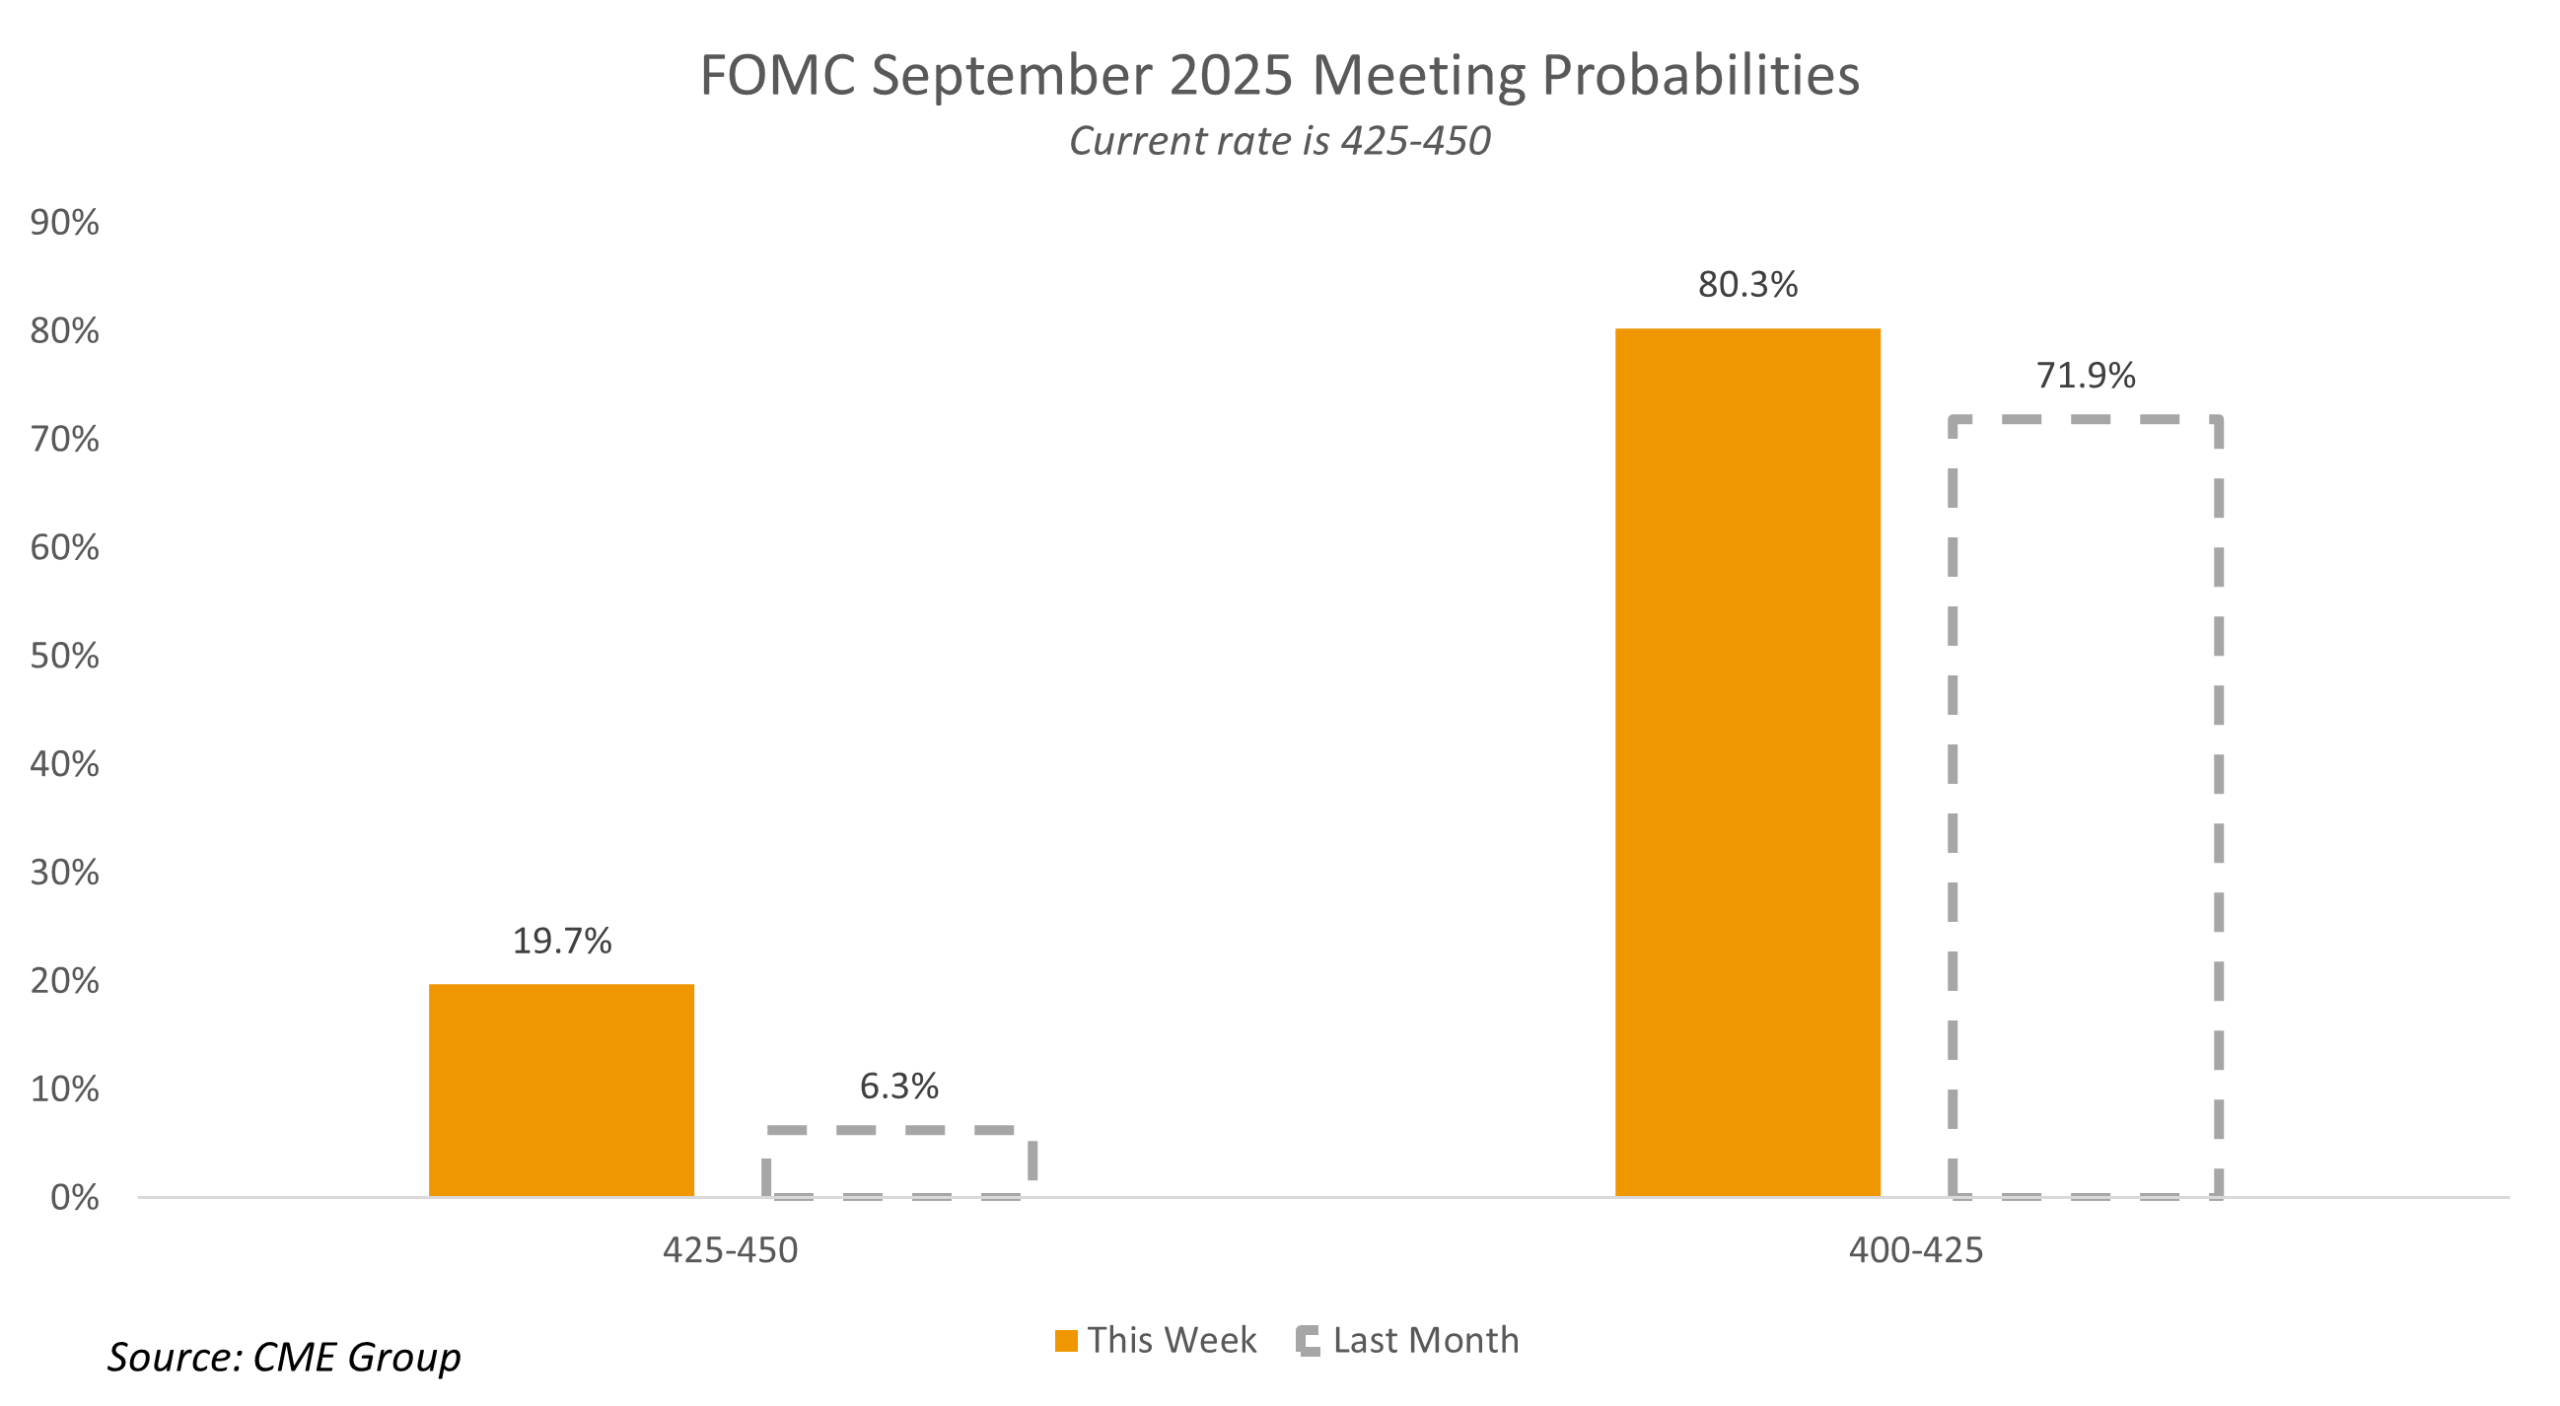
- The Fed kept rates steady at the Wednesday FOMC meeting, with two Fed governors dissenting for the first time since 1993. The committee’s decision to keep rates unchanged came as inflation ticked up, remaining above the 2.0% target, and the labor market appeared resilient, a perception that was later challenged by Friday’s significant downward revision to job numbers. July’s jobs report backs the Fed into a corner, stuck between high inflation and a dimming job market, setting up the U.S. economy for a period of mild stagflation. Following the news, the probability of a 25-bps rate cut in the September meeting soared to over 80%, as investors now expect the Fed to support the weakening labor market over fighting inflation.
- In other news, President Trump announced a new round of tariffs, raising the effective rate above 15%, rattling markets and increasing demand for safe-haven assets (e.g. Treasuries, Gold). Trading partners such as the European Union and South Korea were among the parties that reached a trade deal. Brazil, Canada, and India remain opposed to negotiations, while China and Mexico continue trade talks for a final agreement.
- In earnings, all four “Magnificent Seven” names that reported posted strong results that easily surpassed expectations on all major lines without exception. Meta (META) was the standout name with its 26% top line growth and revenue guidance for the next quarter that topped estimates by 9%. The results highlighted the strength of their core business at a time when the company is fully committed to reinvesting profits into its AI aspirations. Microsoft (MSFT) was not far behind with its 18% revenue growth, driven by higher AI product adoption at Azure which accelerated the previous quarter’s 35% growth rate to a stellar 39%. Apple (APPL) returned to a better growth environment as it grew sales 9.6% during 2Q, driven by better-than-expected iPhone & Mac sales as consumers swarmed stores to front run tariffs. CEO Tim Cook assured investors its AI Siri product development is making strides and is the current core focus of the firm. Lastly, Amazon’s (AMZN) 13% revenue growth and strong profitability was overshadowed by investor disappointment around the 17% growth rate in the AWS division. The slowdown in the cloud-computing division shows the potential impact AI can have on growth, as AWS is lagging the comparable divisions of peers Alphabet (GOOGL) and Microsoft who delivered double the top line growth.
- In other earnings news, United Healthcare (UNH), Paypal (PYPL), Starbucks (SBUX), Coinbase (COIN), Roku (ROKU), Arm Holdings (ARM), Spotify (SPOT) and Confluent (CFLT) were the biggest disappointments, while Lam Research (LRCX), Sofi (SOFI), Reddit (RDDT), eBay (EBAY), Carvana (CVNA), Vertiv (VRT), and Visa (V) led positive results.
- In corporate news, Advanced Micro Devices (AMD) increased the price of its AI centric GPU Chip from US $15k to US $25k, now just below rival Nvidia’s (NVDA) Blackwell chip, stating it has significantly closed the gap in delivered performance. Additionally, cybersecurity company Palo Alto (PANW) agreed to acquire rival firm CyberArk (CYBR) for US $20Bi.
The Week Ahead
- Palantir (PLTR), Advanced Micro (AMD), Uber (UBER), Applovin (APP), AirBnB (ABNB), DoorDash (DASH), Pfizer (PFE), Eli Lilly (LLY), Caterpillar (CAT), Disney (DIS), McDonalds (MCD), and Vistra (VST) are among the companies set to report earnings this week.
- We have another big week for macro data. All eyes will be on the ISM Services PMI, which will provide insights into service-sector activity and consumer trends following recent economic reports. Inflation trends will also be in focus with the release of the Consumer Price Index (CPI) for July. This macro data, along with other key indicators, will be closely watched by investors and policymakers. The data, arriving days ahead of Fed Chair Jerome Powell’s next public appearance at the annual Fed symposium in Jackson Hole, could be a determining factor for any policy actions or interest rate decisions at the Federal Open Market Committee’s (FOMC) September meeting.
Market Summary – Returns and Yields
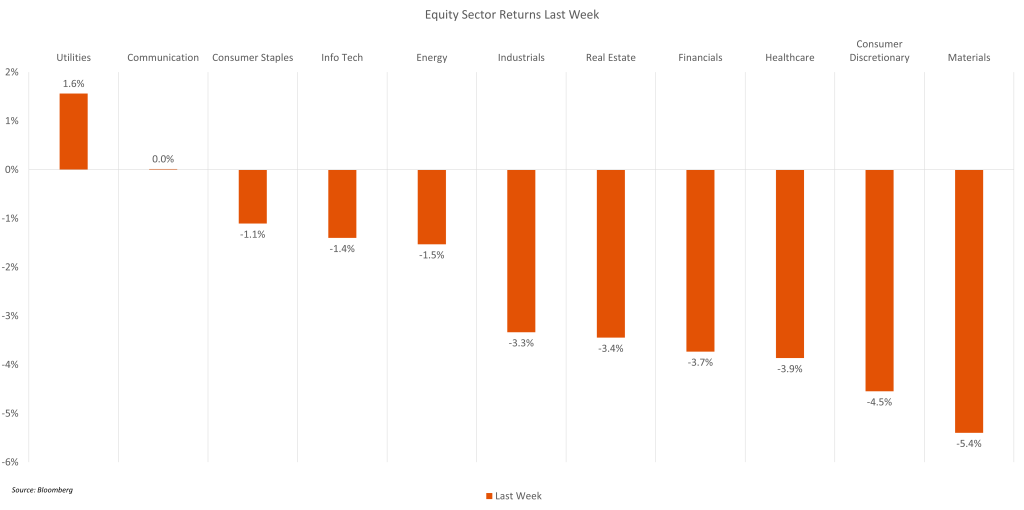
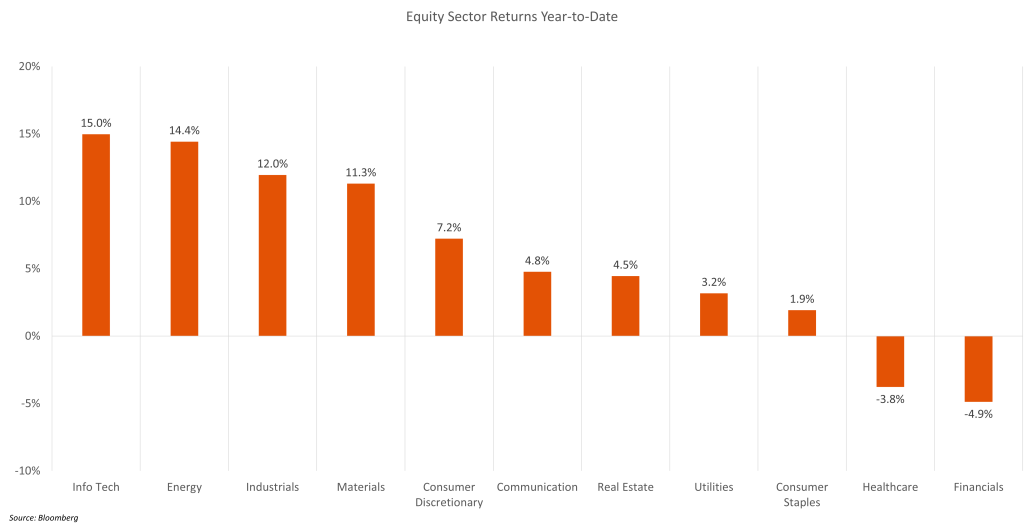
- After reaching all-time highs early last week, equity sectors fell across the board apart from utilities. Despite the fall, equity performance remains strong year-to-date, with the exception of the healthcare and financial sectors which remain in the negatives.
For additional insights, be sure to check out last week’s blog post.
Definitions, sources, and disclaimers
This content is being published by Amerant Investments, Inc (Amerant Investments), a dually registered broker-dealer and investment adviser registered with the Securities and Exchange Commission (SEC) and member of FINRA/SIPC. Registration does not imply a certain level of skill, endorsement, or approval. Amerant Investments is an affiliate of Amerant Bank.
Definitions:
- Gross Domestic Product (GDP): A comprehensive measure of U.S. economic activity. GDP is the value of the goods and services produced in the United States. The growth rate of GDP is the most popular indicator of the nation’s overall economic health. Source: Bureau of Economic Analysis (BEA).
- GDPNow is not an official forecast of the Atlanta Fed. Rather, it is best viewed as a running estimate of real GDP growth based on available economic data for the current measured quarter. There are no subjective adjustments made to GDPNow—the estimate is based solely on the mathematical results of the model. In particular, it does not capture the impact of COVID-19 and social mobility beyond their impact on GDP source data and relevant economic reports that have already been released. It does not anticipate their impact on forthcoming economic reports beyond the standard internal dynamics of the model.
- The Current Employment Statistics (CES) program produces detailed industry estimates of nonfarm employment, hours, and earnings of workers on payrolls. CES National Estimates produces data for the nation, and CES State and Metro Area produces estimates for all 50 States, the District of Columbia, Puerto Rico, the Virgin Islands, and about 450 metropolitan areas and divisions. Each month, CES surveys approximately 142,000 businesses and government agencies, representing approximately 689,000 individual worksites. Source: Bureau of Labor Statistics (BLS).
- Initial Claims: An initial claim is a claim filed by an unemployed individual after a separation from an employer. The claimant requests a determination of basic eligibility for the UI program. When an initial claim is filed with a state, certain programmatic activities take place and these result in activity counts including the count of initial claims. The count of U.S. initial claims for unemployment insurance is a leading economic indicator because it is an indication of emerging labor market conditions in the country. However, these are weekly administrative data which are difficult to seasonally adjust, making the series subject to some volatility. Source: US Department of Labor (DOL).
- The Consumer Price Index (CPI): Is a measure of the average change over time in the prices paid by urban consumers for a market basket of consumer goods and services. Indexes are available for the U.S. and various geographic areas. Average price data for select utility, automotive fuel, and food items are also available. Source: Bureau of Labor Statistics (BLS).
- The national unemployment rate: Perhaps the most widely known labor market indicator, this statistic reflects the number of unemployed people as a percentage of the labor force. Source: Bureau of Labor Statistics (BLS).
- The number of people in the labor force. This measure is the sum of the employed and the unemployed. In other words, the labor force level is the number of people who are either working or actively seeking work.Source: Bureau of Labor Statistics (BLS).
- Advance Monthly Sales for Retail and Food Services: Estimated monthly sales for retail and food services, adjusted and unadjusted for seasonal variations. Source: United States Census Bureau.
- Federal Open Market Committee (FOMC): Responsible for implementing Open market Operations (OMOs)–the purchase and sale of securities in the open market by a central bank—which are a key tool used by the US Federal Reserve in the implementation of monetary policy. Source: Federal Reserve.
- The Federal Funds Rate: Is the interest rate at which depository institutions trade federal funds (balances held at Federal Reserve Banks) with each other overnight. When a depository institution has surplus balances in its reserve account, it lends to other banks in need of larger balances. In simpler terms, a bank with excess cash, which is often referred to as liquidity, will lend to another bank that needs to quickly raise liquidity. Source: Federal Reserve Bank of St. Louis.
- The “core” PCE price index: Is defined as personal consumption expenditures (PCE) prices excluding food and energy prices. The core PCE price index measures the prices paid by consumers for goods and services without the volatility caused by movements in food and energy prices to reveal underlying inflation trends. Source: Bureau of Economic Analysis (BEA).
Sources: U.S. Bureau of Economic Analysis (BEA), Bureau of Labor Statistics (BLS), U.S. Department of Labor (DOL), Federal Reserve, Federal Reserve Economic Database (FRED), Federal Reserve Bank of Atlanta, U.S. Census Bureau, Department of Housing and Human Development (HUD), U.S. Department of Agriculture, U.S. Energy Information Administration (EIA), U..S Department of the Treasury, Office of the United States Trade Representative (USTR), U.S. Department of Commerce, data.gov, investor.gov, usa.gov, congress.gov, whitehouse.gov, U.S. Securities and Exchange Commission (SEC), Morningstar, The International Monetary Funds (IMF), The World Bank (WB), European Central bank (ECB), Bank of Japan (BOJ), European Parliament, Eurostats, Organization for Economic Co-operation and Development (OECD), National Bureau of Statistics of the People’s Republic of China, Organization of the Petroleum Exporting Countries (OPEC), World health organization (WHO).
Financial Markets – Recent Prices and Yields, and Weekly, Monthly, and YTD (Table): Bloomberg, Weekly Market Data is in USD and refers to the following indices: Macro & Market Indicators: Volatility (VIX); Oil (WTI); Dollar Index (DXA); Inflation (CPI YoY); Fixed Income: All U.S. Bonds (Bloomberg Aggregate Index); Investment Grade Corporates (Bloomberg US Corporate Index); US High Yield (Bloomberg High Yield Index), Treasuries (ICE BofA Treasury Indices); Equities: U.S. Industrials (Dow Jones Industrial Average); U.S. Large Caps (S&P 500); U.S Tech Equities (Nasdaq Composite); European (MSCI Euope), Asia Pacific (MSCI AP), and Latin America Equities (MSCI LA); Sectors (S&P 500 GICS Sectors) Source: Bloomberg. Fed Funds Rate probabilities, Source: CME FedWatch Tool.
Important Disclosures:
The information provided here is for general informational purposes only and should not be considered a customized recommendation, personalized investment advice offer, or solicitation for the purchase or sale of any security or investment strategy. The investment strategies mentioned here may not be suitable for everyone. Each investor needs to review an investment strategy for his or her own situation before making any investment decision.
This information is obtained by AMTI from third-party providers from what are considered reliable sources. However, its accuracy, completeness or reliability cannot be guaranteed. Examples provided are for illustrative purposes only and not intended to be reflective of results you can expect to achieve. All expressions of opinion are subject to change without notice in reaction to changes in market conditions. By using such information, you release and exonerate AMTI from any responsibility for damages, direct or indirect, that may result from such use. Consult the issuer of any investment for the most up-to-date and accurate information.
All references to performance refer to historical data. There could be benchmarks used that do not reflect the performance of funds or other products with similar objectives
Presentation does not apply in jurisdictions where its use has not been approved. Some products or strategies may be complex or unusual. Make sure you have a clear understanding of the products before investing. Investments may have different tax consequences in different jurisdictions and will depend on the circumstances. AMTI does not offer legal or tax advice, please consult your legal, CPA, or other tax professional regarding your situation.
Before investing you must consider carefully the investment objectives, risks, charges and expenses of the underlying funds of your selected portfolio. Please contact AMTI to request the prospectus, private placement memorandum or other offering materials containing this and other important information. Please read these materials carefully before investing.
Not FDIC Insured | Not Bank Guaranteed | May Lose Value | Not Insured By Governmental Agencies | Member FINRA/SIPC, Registered Investment Advisor
Additional Risks:
- Past performance is no guarantee of future returns.
- There is no assurance the Fund will pay distributions in any particular amount, if at all. Any distributions the Fund makes will be at the discretion of the Fund’s Board of Trustees
- There can be no assurance that any Fund or investment will achieve it objectives or avoid substantial losses. Actual results may vary
- The value of the investments varies and therefore the amount received at the time of sale might be higher or lower than was originally invested. Actual returns might be better or worse than the ones shown in this informative material.
- Limited liquidity: Investors should not expect to be able to sell shares regardless of how the Fund performs. Investors should consider that they may not have access to the money they invest for an extended period of time.
- Volatile markets: Because an investor may be unable to sell its shares, an investor will be unable to reduce its exposure in any market downturn
- Funds may invest in securities that are rated below investment grade by rating agencies or that would be rated below investment grade if they were rated. Below investment grade securities, which are often referred to as “junk,” have predominantly speculative characteristics with respect to the issuer’s capacity to pay interest and repay principal. They may also be illiquid and difficult to value
Please review the prospectus or related materials for further details regarding risks and other important information. For additional disclosures and other information regarding AMTI including our customer relationship summary, please visit: https://www.amerantbank.com/personal/investing/
Related posts

