


- If you ever watched the game show “Family Feud,” you know that every question was followed by the host asking “Survey says?” to find the top answers. We sense a growing “Family Feud” within the Fed as last week’s FOMC rate decision was accompanied by three dissents, compared to zero at the prior meeting. What does the Treasury market survey say?

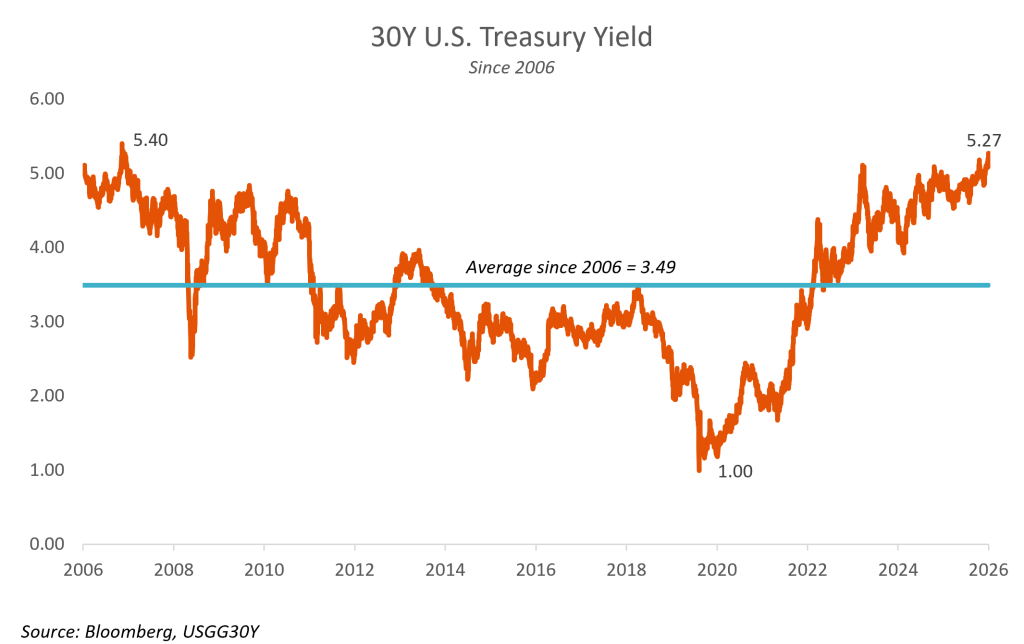
- The market verdict was delivered via the 30Y Treasury, which touched the highest yield since 2007. While confirming the Fed’s commitment to the 2% core PCE target, Fed Chair Warsh did not commit to the timing (“no magic wand”). He also stated that higher interest rates in the market were doing some of the work, thereby implying that the Fed might not have to do as much, as markets are already pricing in tightening financial conditions. As a result, Treasuries bear-steepened. In our view, the problem with this strategy is that markets will eventually push the Fed into a corner, and we sense Warsh “the closet Dove” may have to transform into Warsh “a visible Hawk” to deliver on the Fed’s inflation mandate.
- Following criticism of Fed Chair Warsh’s communication style and questions about the implications of keeping rates on hold despite elevated inflation, there were press reports that the FOMC may consider reducing the number of meetings it holds. In our view, this is a logical outcome. The decision to remove forward guidance means there will be less for the Fed to say, and there’s no necessity to hold an FOMC meeting if there will be nothing to communicate to the markets.
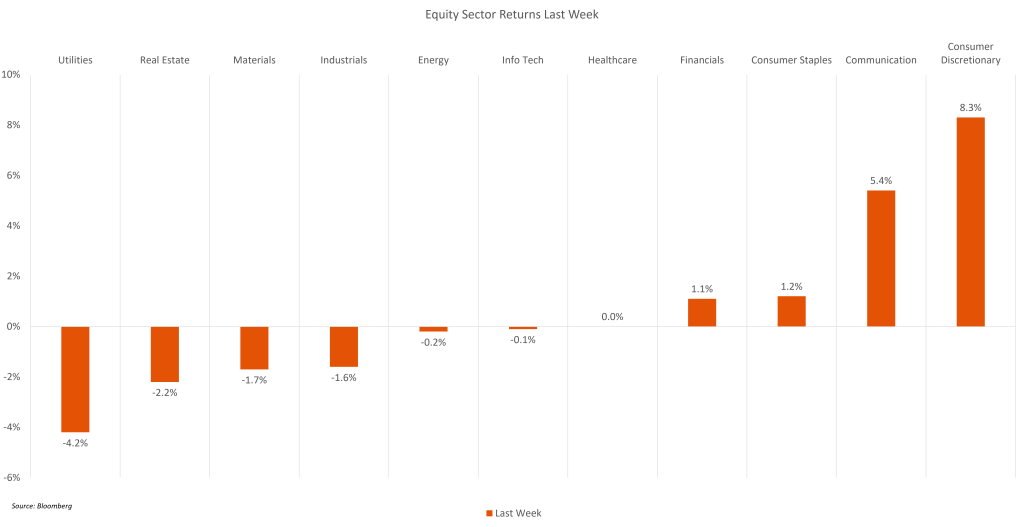
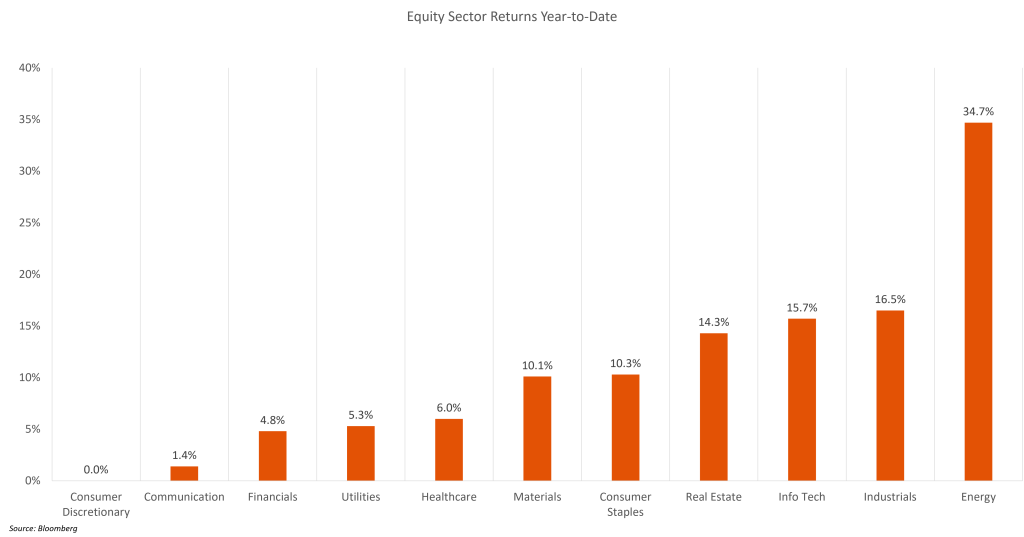
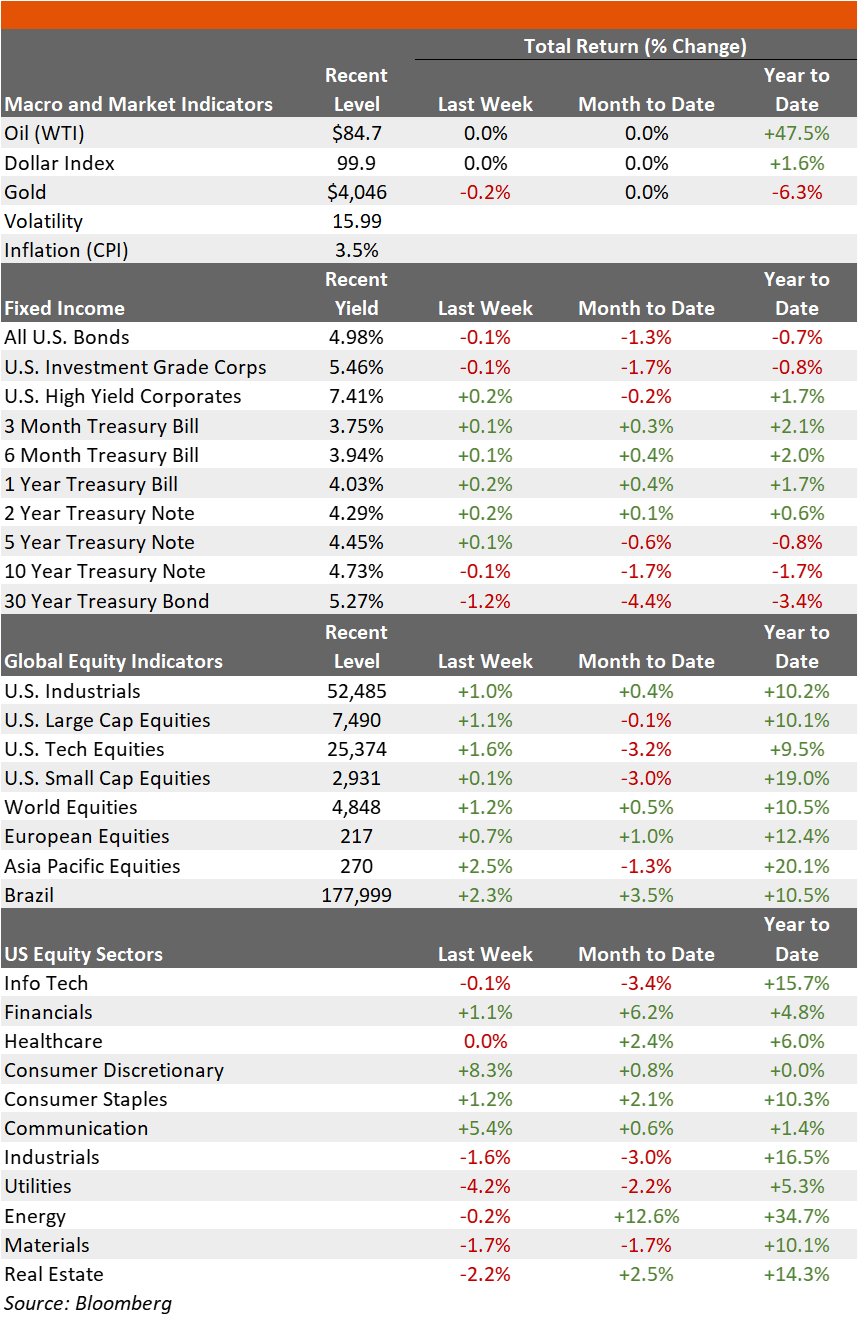
- The major equity indexes were all higher last week. The Nasdaq index rose 1.6%, as four of the Mag 7 reported 2Q26 earnings (which we discuss in detail below). On a weekly basis, Consumer Discretionary was the best-performing sector, while interest-rate-sensitive sectors such as Utilities and Real Estate were the laggards. We note that with the rally in the Consumer Discretionary sector last week, no equity sector is lower for the year-to-date, with Energy the best performing so far this year.
- In earnings last week, Amazon (AMZN) and Microsoft (MSFT) were the highlights, as both posted stellar EPS beats and eased fears regarding returns on large AI Capex outlays, with AI product revenues accelerating above estimates, with Amazon’s Azure division growth +36% and Microsoft’s Cloud division +40% on an annual basis. In contrast, Meta (META) and Apple (AAPL) were met with investor disappointment. META missed on all major lines, amidst high expectations, while providing no encouraging signs regarding AI revenue growth contribution. Apple posted a modest beat, but missed on forward guidance, citing input costs and capacity constraints as culprits.
- Other earnings highlights included Teradyne (TER), Seagate (STX), Bloom Energy (BE), Amphenol (APH), Fortinet (FTNT), Lam Research (LRCX), Quanta (PWR) and Monolithic Power (PWR), while disappointments came from Coinbase (COIN), Roblox (RBLX), Qualcomm (QCOM) and Corning (GLW).
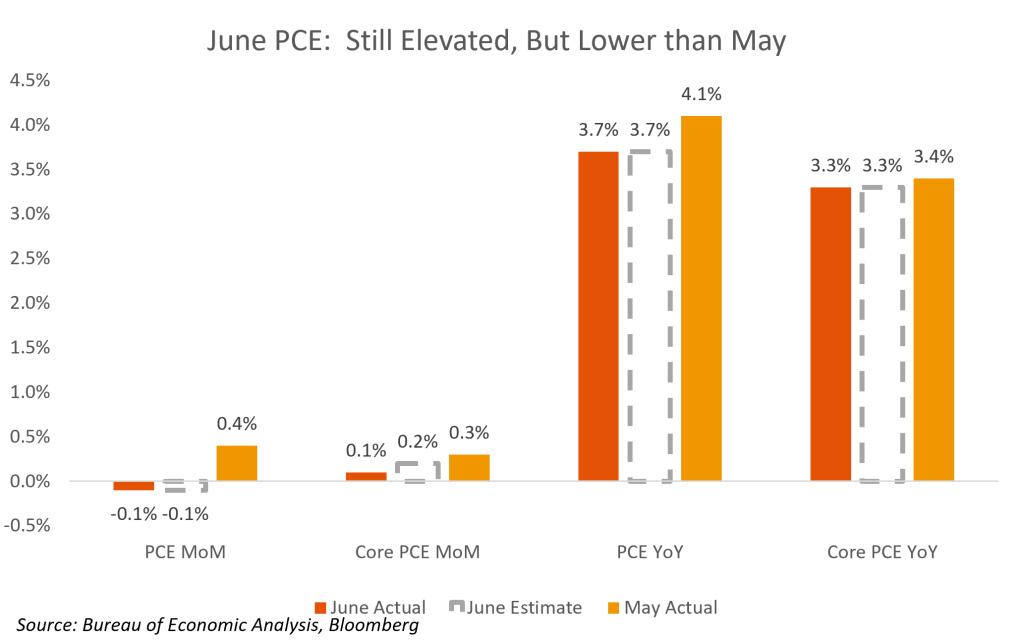
- In macro data last week, PCE data for June came in mostly as expected. PCE for June was -0.1%, in line with the estimate and down from the prior month. On a core basis YoY, PCE was 3.3%, in line with the estimate, and down from 3.4% in May, but still above the Fed’s explicit 2% target.
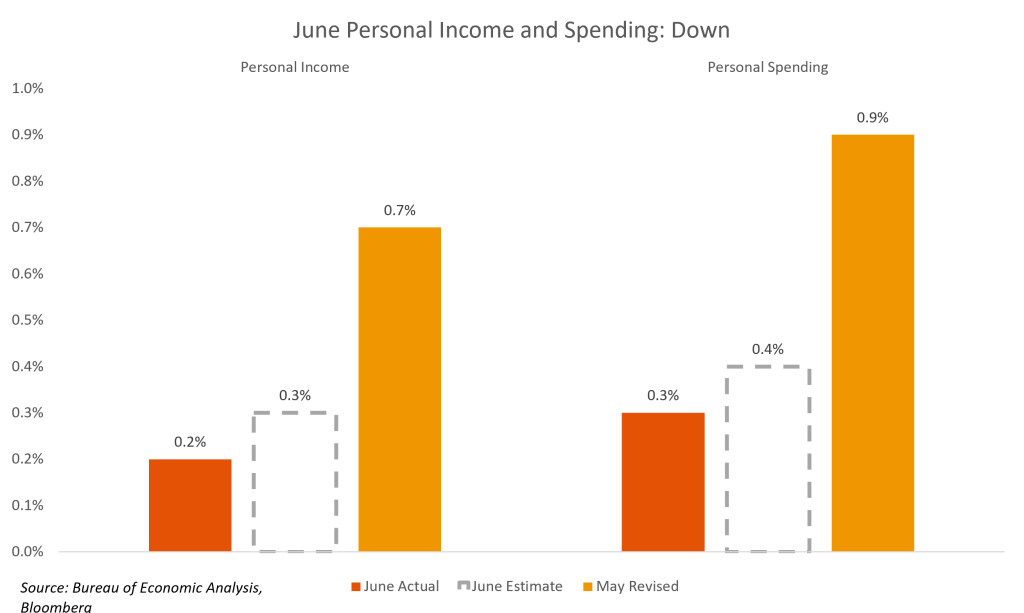
- We also got Personal Income and Spending for June. Personal Income rose by 0.2% MoM, which was lower than the estimate of 0.3% and down from 0.7% in May. Personal Spending was up by 0.3%, which was below the 0.4% estimate and also down from May’s revised figure of 0.9%.
The Week Ahead
- This week earnings reports include Advanced Micro (AMD), SpaceX (SPCX), Palantir (PLTR), SanDisk (SNDK), Western Digital (WDC), Uber (UBER), AirBnB (ABNB), Pfizer (PFE), McDonald’s (MCD), Eli & Lilly (LLY), Disney (DIS), DoorDash (DASH), eBay (EBAY), Booking.com (BKNG), Astera Labs (ALAB) and Arista (ANET).
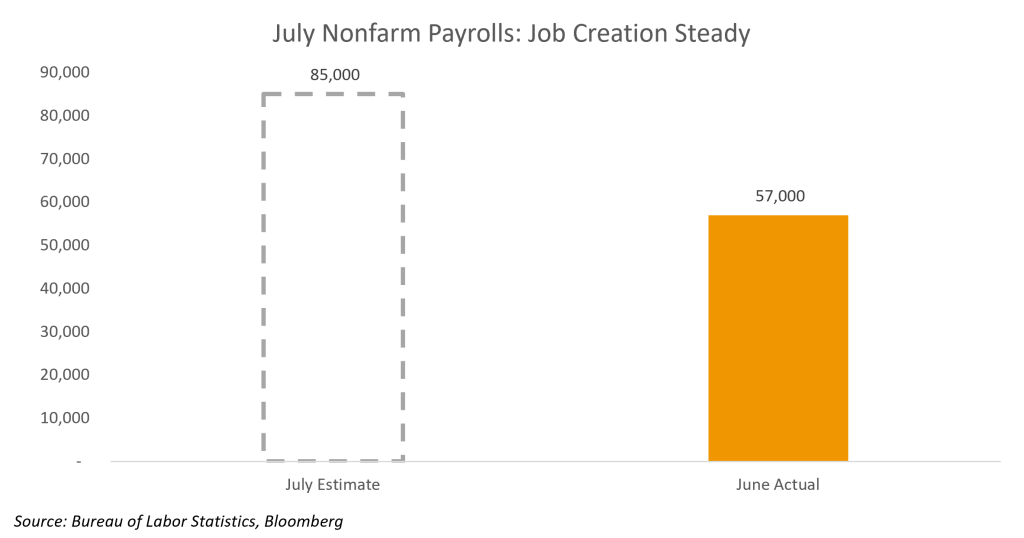
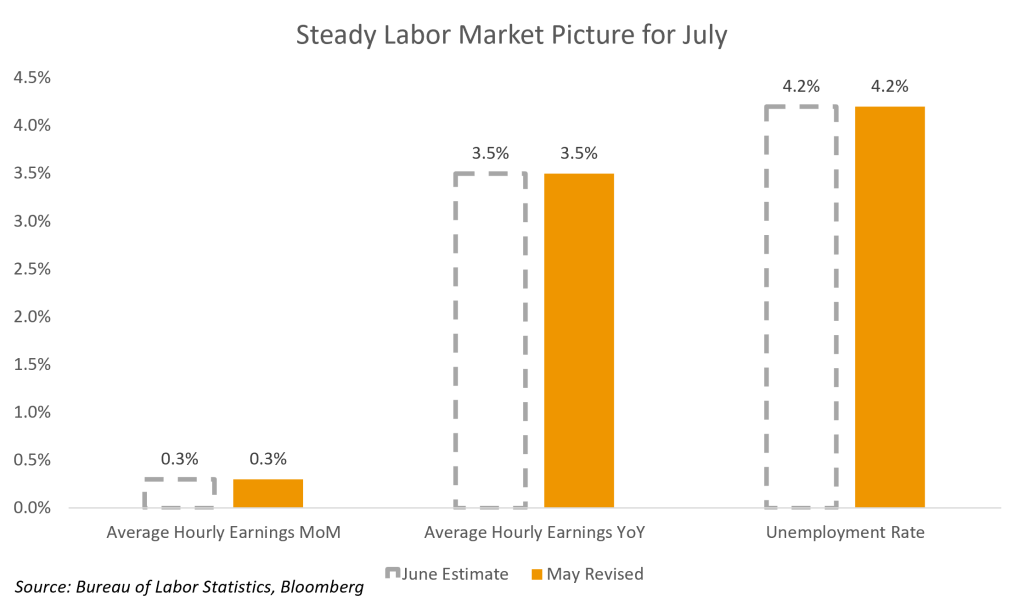
- On Friday, we have the July payroll report. Nonfarm payrolls are forecast to climb by 85,000, compared to 57,000 in June. The unemployment rate is expected to remain unchanged at 4.2%, with average hourly earnings up by 0.3% MoM, also unchanged.
Market Summary – Returns and Yields
- All major U.S. equity indices are higher for the year-to-date, while bonds are mixed.
For additional insights, be sure to check out last week’s blog post.
Definitions, sources, and disclaimers
This content is being published by Amerant Investments, Inc (Amerant Investments), a dually registered broker-dealer and investment adviser registered with the Securities and Exchange Commission (SEC) and member of FINRA/SIPC. Registration does not imply a certain level of skill, endorsement, or approval. Amerant Investments is an affiliate of Amerant Bank.
Definitions:
- Gross Domestic Product (GDP): A comprehensive measure of U.S. economic activity. GDP is the value of the goods and services produced in the United States. The growth rate of GDP is the most popular indicator of the nation’s overall economic health. Source: Bureau of Economic Analysis (BEA).
- GDPNow is not an official forecast of the Atlanta Fed. Rather, it is best viewed as a running estimate of real GDP growth based on available economic data for the current measured quarter. There are no subjective adjustments made to GDPNow—the estimate is based solely on the mathematical results of the model. In particular, it does not capture the impact of COVID-19 and social mobility beyond their impact on GDP source data and relevant economic reports that have already been released. It does not anticipate their impact on forthcoming economic reports beyond the standard internal dynamics of the model.
- The Current Employment Statistics (CES) program produces detailed industry estimates of nonfarm employment, hours, and earnings of workers on payrolls. CES National Estimates produces data for the nation, and CES State and Metro Area produces estimates for all 50 States, the District of Columbia, Puerto Rico, the Virgin Islands, and about 450 metropolitan areas and divisions. Each month, CES surveys approximately 142,000 businesses and government agencies, representing approximately 689,000 individual worksites. Source: Bureau of Labor Statistics (BLS).
- Initial Claims: An initial claim is a claim filed by an unemployed individual after a separation from an employer. The claimant requests a determination of basic eligibility for the UI program. When an initial claim is filed with a state, certain programmatic activities take place and these result in activity counts including the count of initial claims. The count of U.S. initial claims for unemployment insurance is a leading economic indicator because it is an indication of emerging labor market conditions in the country. However, these are weekly administrative data which are difficult to seasonally adjust, making the series subject to some volatility. Source: US Department of Labor (DOL).
- The Consumer Price Index (CPI): Is a measure of the average change over time in the prices paid by urban consumers for a market basket of consumer goods and services. Indexes are available for the U.S. and various geographic areas. Average price data for select utility, automotive fuel, and food items are also available. Source: Bureau of Labor Statistics (BLS).
- The national unemployment rate: Perhaps the most widely known labor market indicator, this statistic reflects the number of unemployed people as a percentage of the labor force. Source: Bureau of Labor Statistics (BLS).
- The number of people in the labor force. This measure is the sum of the employed and the unemployed. In other words, the labor force level is the number of people who are either working or actively seeking work.Source: Bureau of Labor Statistics (BLS).
- Advance Monthly Sales for Retail and Food Services: Estimated monthly sales for retail and food services, adjusted and unadjusted for seasonal variations. Source: United States Census Bureau.
- Federal Open Market Committee (FOMC): Responsible for implementing Open market Operations (OMOs)–the purchase and sale of securities in the open market by a central bank—which are a key tool used by the US Federal Reserve in the implementation of monetary policy. Source: Federal Reserve.
- The Federal Funds Rate: Is the interest rate at which depository institutions trade federal funds (balances held at Federal Reserve Banks) with each other overnight. When a depository institution has surplus balances in its reserve account, it lends to other banks in need of larger balances. In simpler terms, a bank with excess cash, which is often referred to as liquidity, will lend to another bank that needs to quickly raise liquidity. Source: Federal Reserve Bank of St. Louis.
- The “core” PCE price index: Is defined as personal consumption expenditures (PCE) prices excluding food and energy prices. The core PCE price index measures the prices paid by consumers for goods and services without the volatility caused by movements in food and energy prices to reveal underlying inflation trends. Source: Bureau of Economic Analysis (BEA).
Sources: U.S. Bureau of Economic Analysis (BEA), Bureau of Labor Statistics (BLS), U.S. Department of Labor (DOL), Federal Reserve, Federal Reserve Economic Database (FRED), Federal Reserve Bank of Atlanta, U.S. Census Bureau, Department of Housing and Human Development (HUD), U.S. Department of Agriculture, U.S. Energy Information Administration (EIA), U..S Department of the Treasury, Office of the United States Trade Representative (USTR), U.S. Department of Commerce, data.gov, investor.gov, usa.gov, congress.gov, whitehouse.gov, U.S. Securities and Exchange Commission (SEC), Morningstar, The International Monetary Funds (IMF), The World Bank (WB), European Central bank (ECB), Bank of Japan (BOJ), European Parliament, Eurostats, Organization for Economic Co-operation and Development (OECD), National Bureau of Statistics of the People’s Republic of China, Organization of the Petroleum Exporting Countries (OPEC), World health organization (WHO).
Financial Markets – Recent Prices and Yields, and Weekly, Monthly, and YTD (Table): Bloomberg, Weekly Market Data is in USD and refers to the following indices: Macro & Market Indicators: Volatility (VIX); Oil (WTI); Dollar Index (DXA); Inflation (CPI YoY); Fixed Income: All U.S. Bonds (Bloomberg Aggregate Index); Investment Grade Corporates (Bloomberg US Corporate Index); US High Yield (Bloomberg High Yield Index), Treasuries (ICE BofA Treasury Indices); Equities: U.S. Industrials (Dow Jones Industrial Average); U.S. Large Caps (S&P 500); U.S Tech Equities (Nasdaq Composite); European (MSCI Euope), Asia Pacific (MSCI AP), and Latin America Equities (MSCI LA); Sectors (S&P 500 GICS Sectors) Source: Bloomberg. Fed Funds Rate probabilities, Source: CME FedWatch Tool.
Important Disclosures:
The information provided here is for general informational purposes only and should not be considered a customized recommendation, personalized investment advice offer, or solicitation for the purchase or sale of any security or investment strategy. The investment strategies mentioned here may not be suitable for everyone. Each investor needs to review an investment strategy for his or her own situation before making any investment decision.
This information is obtained by AMTI from third-party providers from what are considered reliable sources. However, its accuracy, completeness or reliability cannot be guaranteed. Examples provided are for illustrative purposes only and not intended to be reflective of results you can expect to achieve. All expressions of opinion are subject to change without notice in reaction to changes in market conditions. By using such information, you release and exonerate AMTI from any responsibility for damages, direct or indirect, that may result from such use. Consult the issuer of any investment for the most up-to-date and accurate information.
All references to performance refer to historical data. There could be benchmarks used that do not reflect the performance of funds or other products with similar objectives
Presentation does not apply in jurisdictions where its use has not been approved. Some products or strategies may be complex or unusual. Make sure you have a clear understanding of the products before investing. Investments may have different tax consequences in different jurisdictions and will depend on the circumstances. AMTI does not offer legal or tax advice, please consult your legal, CPA, or other tax professional regarding your situation.
Before investing you must consider carefully the investment objectives, risks, charges and expenses of the underlying funds of your selected portfolio. Please contact AMTI to request the prospectus, private placement memorandum or other offering materials containing this and other important information. Please read these materials carefully before investing.
Not FDIC Insured | Not Bank Guaranteed | May Lose Value | Not Insured By Governmental Agencies | Member FINRA/SIPC, Registered Investment Advisor
Additional Risks:
- Past performance is no guarantee of future returns.
- There is no assurance the Fund will pay distributions in any particular amount, if at all. Any distributions the Fund makes will be at the discretion of the Fund’s Board of Trustees
- There can be no assurance that any Fund or investment will achieve it objectives or avoid substantial losses. Actual results may vary
- The value of the investments varies and therefore the amount received at the time of sale might be higher or lower than was originally invested. Actual returns might be better or worse than the ones shown in this informative material.
- Limited liquidity: Investors should not expect to be able to sell shares regardless of how the Fund performs. Investors should consider that they may not have access to the money they invest for an extended period of time.
- Volatile markets: Because an investor may be unable to sell its shares, an investor will be unable to reduce its exposure in any market downturn
- Funds may invest in securities that are rated below investment grade by rating agencies, or that would be rated below investment grade if they were rated. Below investment grade securities, which are often referred to as “junk,” have predominantly speculative characteristics with respect to the issuer’s capacity to pay interest and repay principal. They may also be illiquid and difficult to value
Please review the prospectus or related materials for further details regarding risks and other important information. For additional disclosures and other information regarding AMTI, including our customer relationship summary, please visit: https://www.amerantbank.com/personal/investing/
Related posts
